What Are the Best Solar Power Options in China?

China’s solar market is no longer a single-choice story. Rooftop panels, large ground-mounted plants, and solar paired with batteries each serve different needs. The right fit depends on roof space, local sunlight, grid access, electricity use, and whether power is needed after sunset. Small details matter. A shaded roof or limited grid connection can change the economics.

China’s National Energy Administration reported that installed solar capacity reached about 887 gigawatts by the end of 2024, after roughly 278 gigawatts were added that year. Its annual power-industry figures show the scale of the market, but national growth does not guarantee a good project at every site. The IEA Photovoltaic Power Systems Programme’s Snapshot of Global PV Markets 2025 also places China within a rapidly expanding global solar industry. These sources help frame the choices; they cannot replace a site-specific assessment.

This guide compares practical solar power options in China, from household rooftop systems to utility-scale projects and hybrid systems with storage. It considers where each option works best, what equipment and grid arrangements may be needed, and which trade-offs deserve attention. No single option wins. Payback estimates can look precise while overlooking shading, maintenance, or changing household demand. That uncertainty is worth keeping in view.
What Are the Best Solar Power Options in China?

China’s PV Landscape: 886.66 GW Installed by End-2024 (NEA)

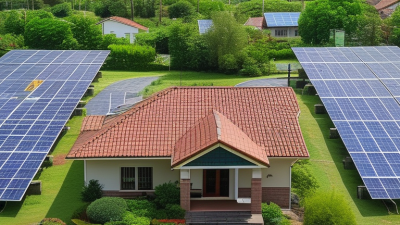
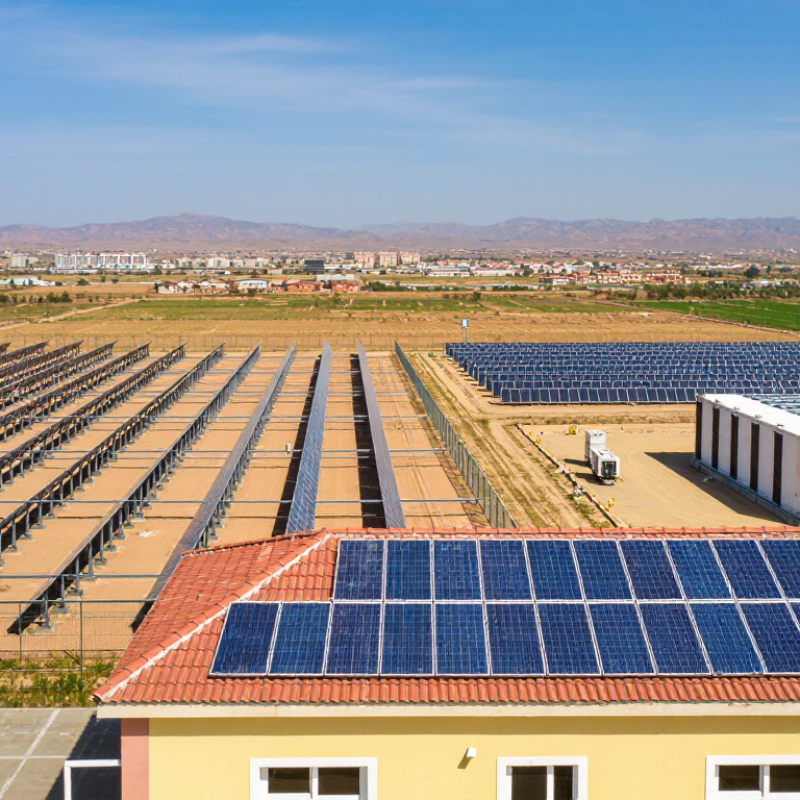
By the end of 2024, China had 886.66 GW of installed solar photovoltaic capacity, according to the National Energy Administration. That figure reflects a vast mix of rooftop systems, commercial installations, and large ground-mounted solar farms. It also shows why “best” depends on location, not just equipment. A sunny industrial roof near a reliable grid connection may suit distributed PV. Open land can support utility-scale projects, but land use and transmission access matter.

The number is impressive. It is not the whole story. Installed capacity measures potential nameplate output, not electricity delivered every hour. Local grid limits, cloud cover, roof shade, and seasonal demand can change a project’s real value.

For a building owner, a roof inspection and a clear review of electricity use are practical starting points. For a remote site, storage may help shift solar power into evening hours, though added cost needs careful checking. I would not assume batteries always make a project better; that is an easy mistake. A useful comparison considers local sunlight, connection costs, maintenance access, and how much power is consumed on site.

Utility-Scale Solar: 159.39 GW of New Capacity Added in 2024 (NEA)

China’s utility-scale solar expansion is moving at remarkable speed. The National Energy Administration (NEA) reported 159.39 GW of new utility-scale capacity in 2024. That figure points to large projects as a major option for adding solar power. Vast, sunlit sites can host rows of panels feeding electricity into the grid. But installed capacity is not the same as dependable power at every hour.

The International Energy Agency’s Renewables 2024 report identifies China as a major driver of global renewable growth. For project planners, the practical questions go beyond panel output: Is the grid connection ready? Can transmission carry midday generation to distant demand? Storage and flexible grid operations can help manage fluctuating supply, but they add cost and planning needs. Large projects also require careful site selection. A strong capacity figure alone cannot show whether a particular project is financially or technically suitable.

Tips: Check the latest NEA figures, grid-access conditions, and local solar-resource data before comparing project options. Look closely at curtailment and storage assumptions, too. They are easy to overlook. The headline is impressive, yet it does not tell the whole story.

What Are the Best Solar Power Options in China? — Utility-Scale Solar: 159.39 GW of New Capacity Added in 2024 (NEA)

Metric 2024 figure What it shows
New utility-scale solar capacity 159.39 GW New capacity added in utility-scale solar projects during 2024.
Total new solar capacity 277.17 GW Total solar capacity added nationwide during 2024.
New distributed solar capacity 117.78 GW Calculated as total new solar capacity minus new utility-scale capacity.
Utility-scale share of new solar capacity 57.5% Utility-scale additions as a share of total new solar capacity; calculated from the figures above.
Distributed share of new solar capacity 42.5% Distributed additions as a share of total new solar capacity; calculated from the figures above.
Solar capacity at year-end 2023 609.49 GW Installed solar power capacity at the end of 2023.
Solar capacity at year-end 2024 886.66 GW Installed solar power capacity at the end of 2024.

Source: National Energy Administration (NEA) figures. Distributed additions and capacity shares are calculated from the reported capacity figures; shares are rounded to one decimal place.

Rooftop and Distributed PV: 117.78 GW of New Capacity Added in 2024 (NEA)

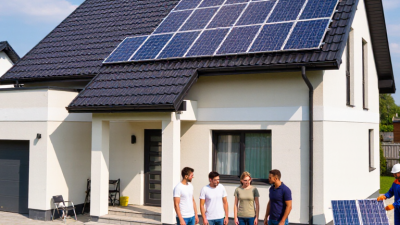
China’s rooftop and distributed solar market added 117.78 GW of new capacity in 2024, according to the National Energy Administration. That is substantial. The figure reflects solar systems spread across homes, factories, warehouses, and other sites, rather than only large power stations. Rooftop panels can generate electricity close to where it is used, reducing some demand from the grid during sunny hours.

The headline number does not mean every roof is ready for panels. Roof age, shade, structure, and wiring all matter. A shaded roof may produce less than its area suggests. Not every roof works. For homes, a suitable system can help cover daytime use, while factories may have broad roofs and steady daytime demand. Still, generation and consumption rarely match perfectly; evening use may require grid power or storage.

Before installation, owners should review structural condition, local connection requirements, and expected output across different seasons. Ask for assumptions behind estimates, including shade and equipment losses. A clean roof can look ideal on paper, but nearby buildings or dust may change performance. I would not treat national growth as proof that each project pays off quickly. Site-level data matters more.

China’s New Solar PV Capacity in 2024

Annual additions by installation type (GW)

China added 277.17 GW of solar PV capacity in 2024. Distributed PV contributed 117.78 GW; centralized PV accounts for the remaining 159.39 GW.

Source: National Energy Administration (NEA), 2024 figures. Centralized PV is calculated as total additions minus distributed PV additions.

Solar-plus-Storage and Off-Grid Systems: Match Design to Grid Access and Demand

What Are the Best Solar Power Options in China?

Solar-plus-Storage and Off-Grid Systems: Match Design to Grid Access and Demand

China’s solar market is expanding quickly: the National Energy Administration reported 886.7 gigawatts of installed solar capacity by the end of 2024. But a strong national grid does not guarantee reliable service at every site. For homes and businesses with grid access, solar-plus-storage can shift daytime generation into evening use and provide backup during outages. Battery size should reflect actual evening demand, outage needs, and the site’s permitted export limits—not just the number of panels.

Remote farms, telecom sites, and mountain facilities may need off-grid systems. Here, design starts with the loads: a water pump’s startup surge, refrigeration overnight, or several cloudy days. The China Energy Storage Alliance reported 73.8 gigawatts of new-type energy storage capacity by the end of 2024, showing rapid growth, though grid-scale figures do not predict the right battery for one property. Storage is not magic. Oversized batteries can sit underused, and my estimate may miss seasonal demand unless measured against real consumption.

Tips: Check a year of electricity bills and note peak loads. Ask an installer to model winter output, battery autonomy, and backup priorities. Leave room for error; weather and usage rarely follow the spreadsheet.

Choosing a Solar Option: Compare Local Yield, Tariffs, Land, and Payback

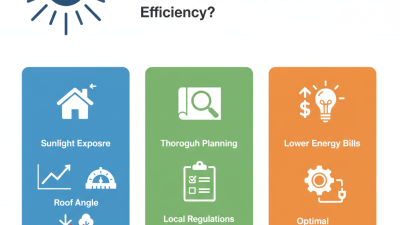
What are the best solar power options in China? The answer depends on local yield, tariffs, available land, and realistic payback—not just panel output. A shaded apartment rooftop in Chengdu may perform very differently from an open factory roof in a sunnier region. Check a site’s orientation, shade, and seasonal sunlight before comparing system sizes. Small differences matter.

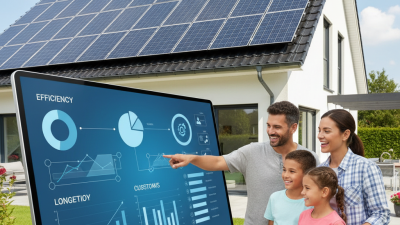
Tariffs shape the value of each kilowatt-hour. Compare your actual electricity bills with current local rates, and confirm how exported power is credited. For a household or business, using more solar electricity on-site can improve the economics when export payments are lower. Ground-mounted projects also need suitable land, grid access, and a careful look at connection costs. Estimate payback using installation, maintenance, financing, and equipment replacement costs. Then test the result with lower-yield and higher-cost assumptions. It may look less attractive. That is useful to know.

Tips: Gather twelve months of bills and request a site-specific yield estimate. Ask what assumptions the payback calculation uses, including system degradation and inverter replacement. Compare scenarios, not promises. If a quote leaves out grid or land costs, pause and check the figures with an independent professional.